So that you as a vendor on Amazon, brand owner or brand manufacturer can keep an eye on your complete portfolio at all times, the brand analysis in AMALYZE Shield automatically summarises all relevant KPIs in one place. For the first time, the visibility and performance of your brand can be compared at any time with other brands in a completely transparent way. The effects of your own brand management strategy are just as visible here as any intervention by Amazon or other retailers who also offer the articles of the brand under investigation.
The brand analysis function is part of the Analysis Module in Shield.
Brand Analysis Overview
If you click on a subscribed brand analysis, you will get to the overview page of the corresponding brand and we will give you the last values determined by us via the displayed tiles. For a quick overview we have coloured the tiles for you: Recently rather negative developments are marked red, positive developments green.
When you mouse over the charts in the tiles, the values determined by AMALYZE are displayed and, of course, the tile fields with the charts in them can also be moved freely on the overview page of the brand analysis and anchored again in another place. With a click on one of the currently 25 displayed tiles or via the vertical navigation of the overview you get to the detail pages of the respective brand analysis. Which values do you need first? The development of the organic visibility of all AINs of this brand? A trend development regarding the reviews? Which of your brand products have the best BSR? The number of sellers, which products of your brand also offer? The buybox quota for your branded products? Everything just a click away.
ASIN Overview & ASIN Type Evaluation
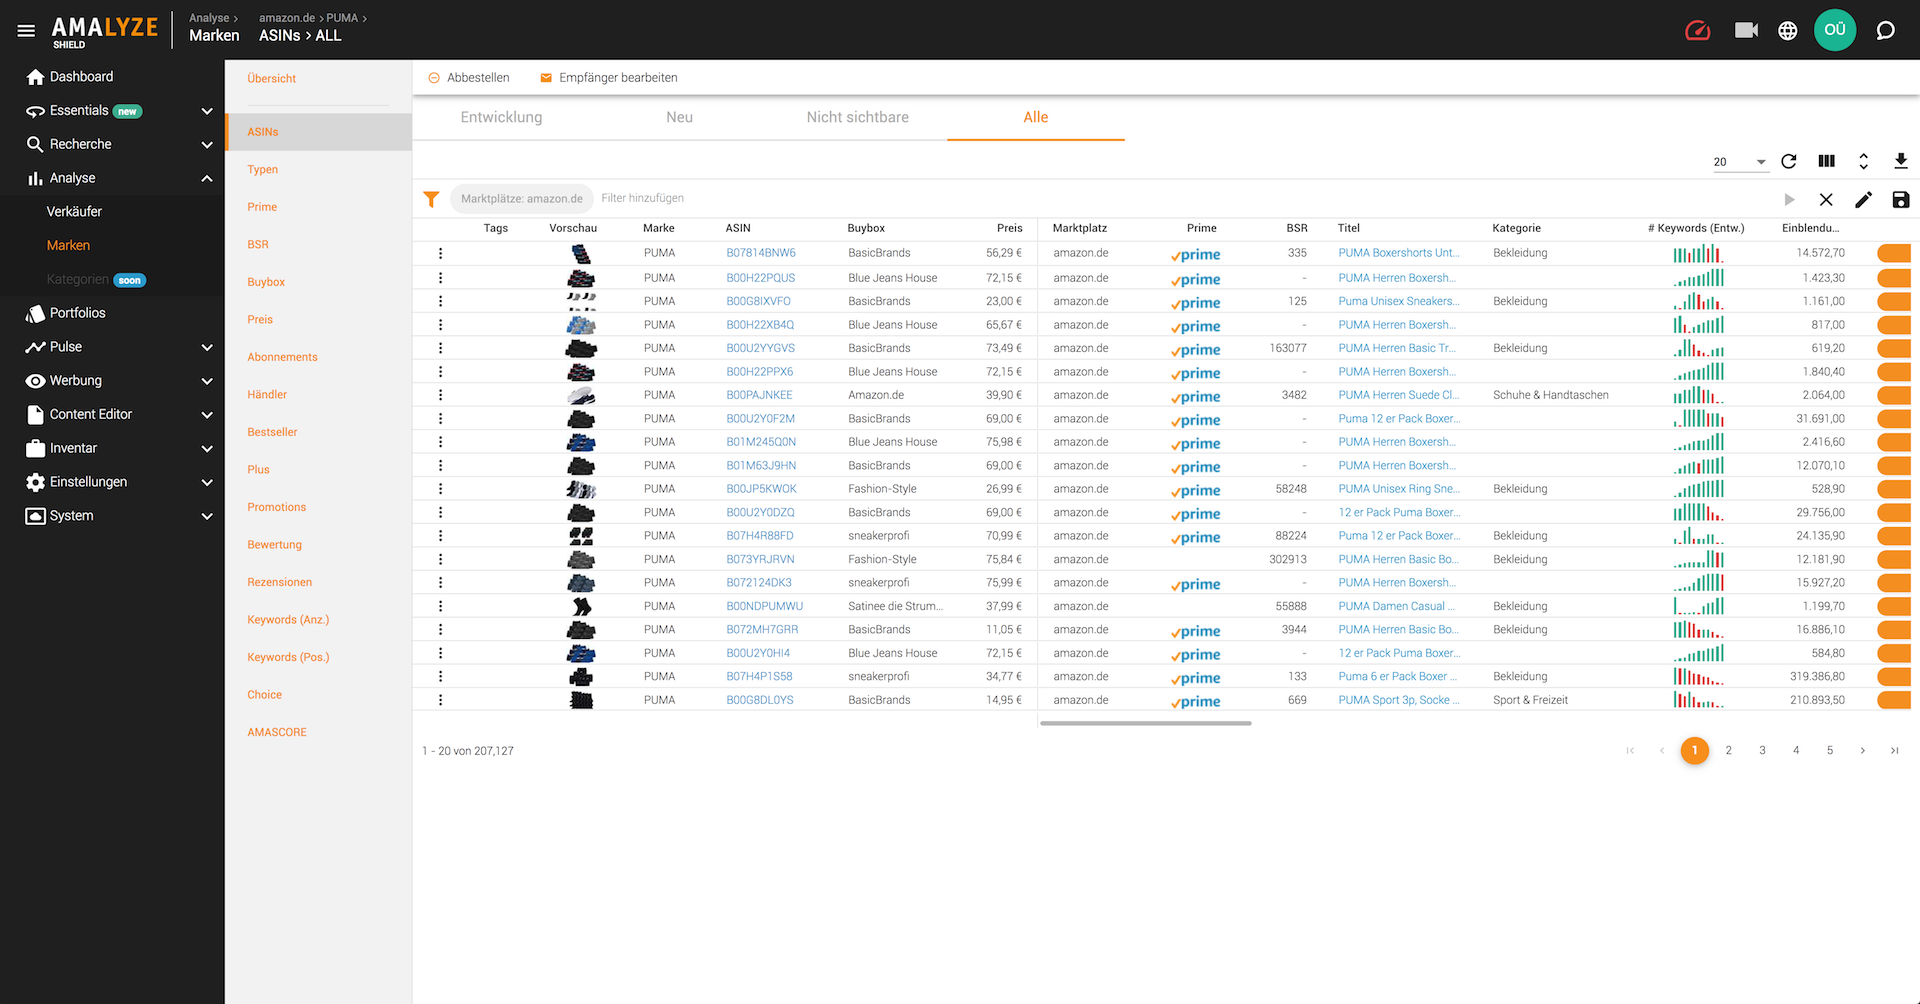
In the ASIN overview we summarize how the number of your branded products has developed on the respective Amazon marketplace and how many of these ASINs are visible to customers on Amazon in a search. From these values we also calculate the quota of ASINs visible to customers on Amazon.
So that you can see how the latest ASINs of a brand are developing, which were only recently discovered by AMALYZE, we also provide you with a results table with all relevant key figures of these new products on Amazon. All ASINs of the respective brand that are not visible on Amazon can be found in a second list. By directly linking the ASINs from Shield to the products on Amazon, you can quickly check whether something is currently wrong with your branded products. Are they currently not (anymore) available or out of stock? Or do these ASINs actually not appear at all in a customer search because there is something wrong with the content?
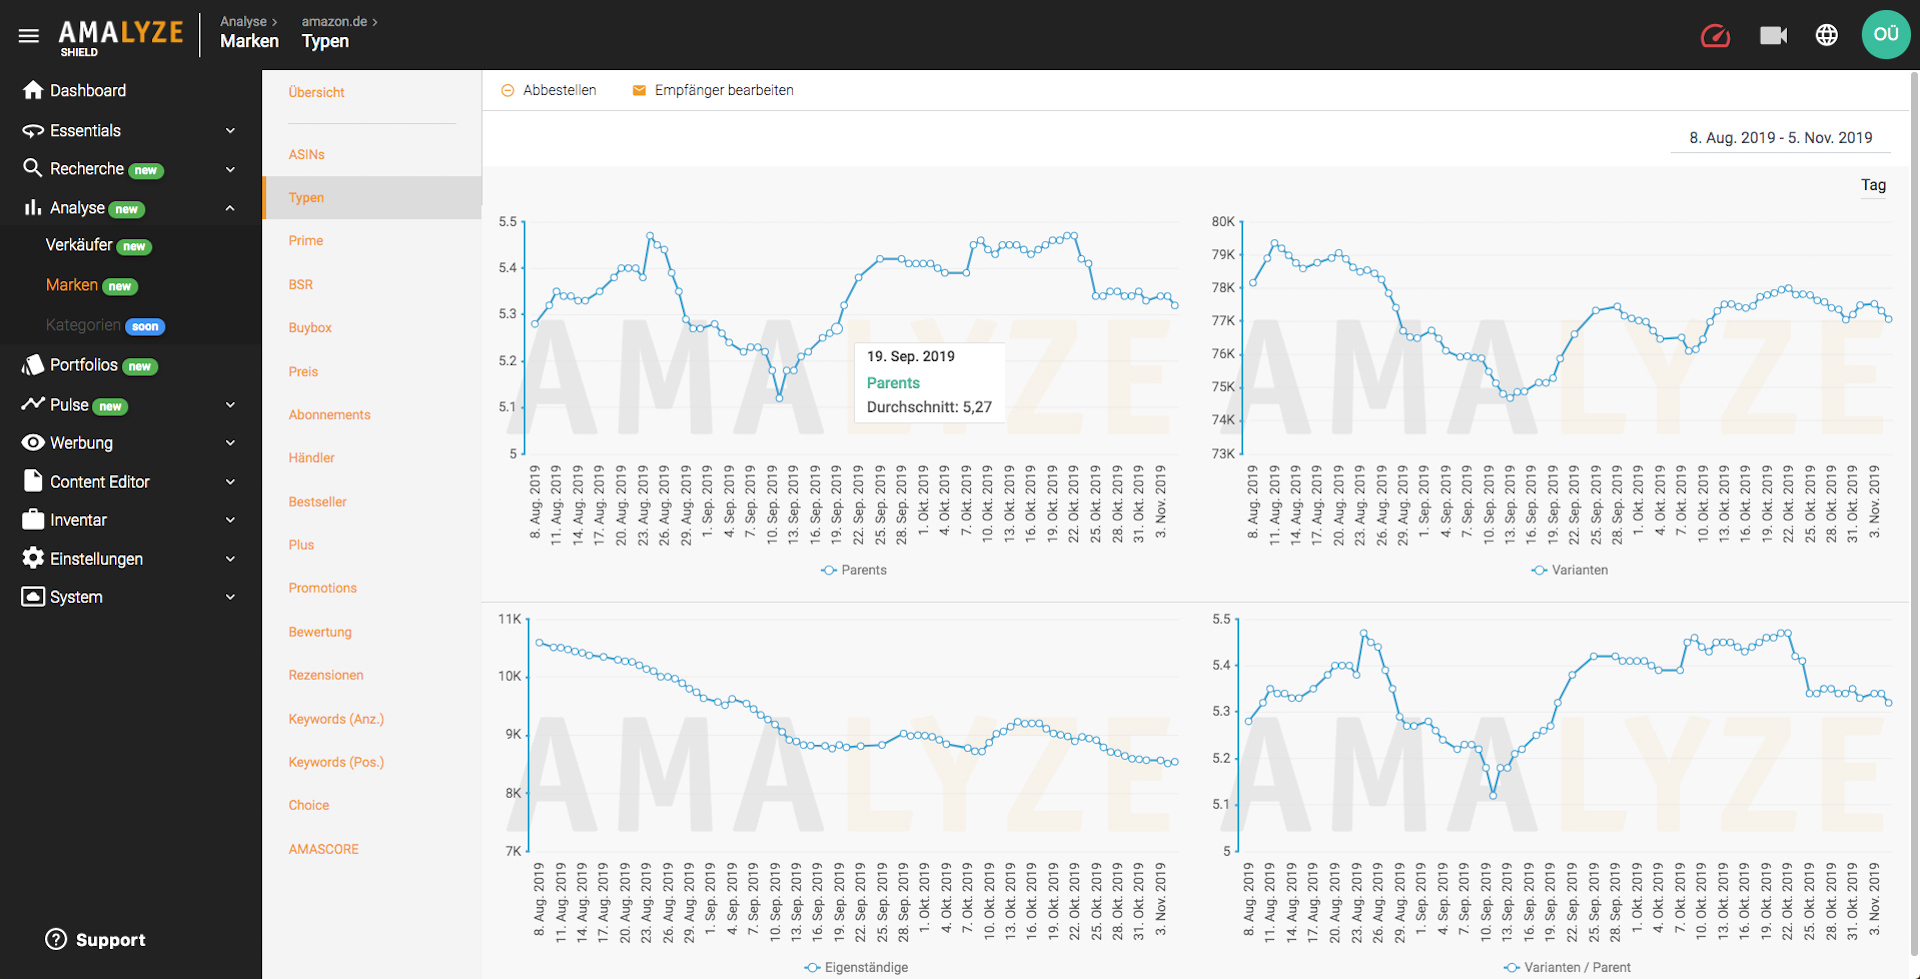
In this section we break down the ASINs in the brand analysis by type. The development of the brand parents is given as well as the number of variants and the number of independent products on Amazon in the respective brand portfolio over time. In addition, we inform you about the average number of variants per parent.
If you would like to examine a longer time frame, you can use the date setting in the upper right corner to select a different or longer time frame after the start and end date, as usual, or to resolve your examination period to different heights.
Quota of Prime Products
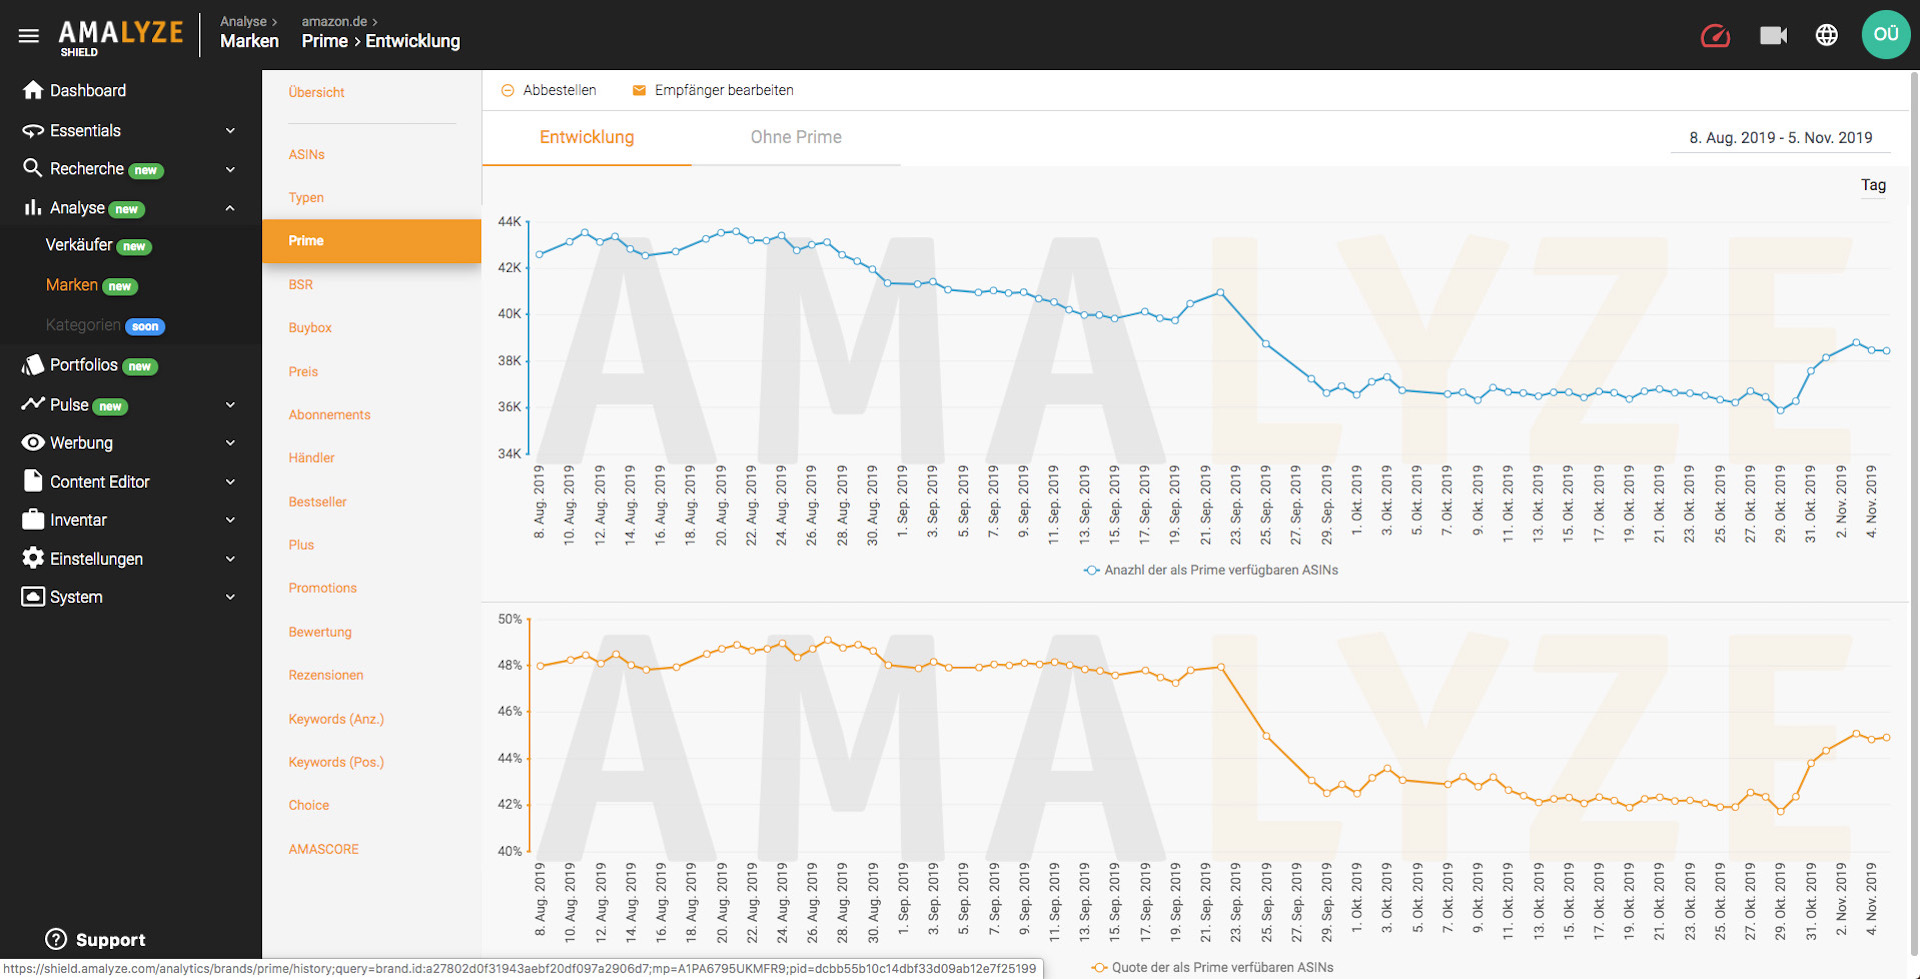
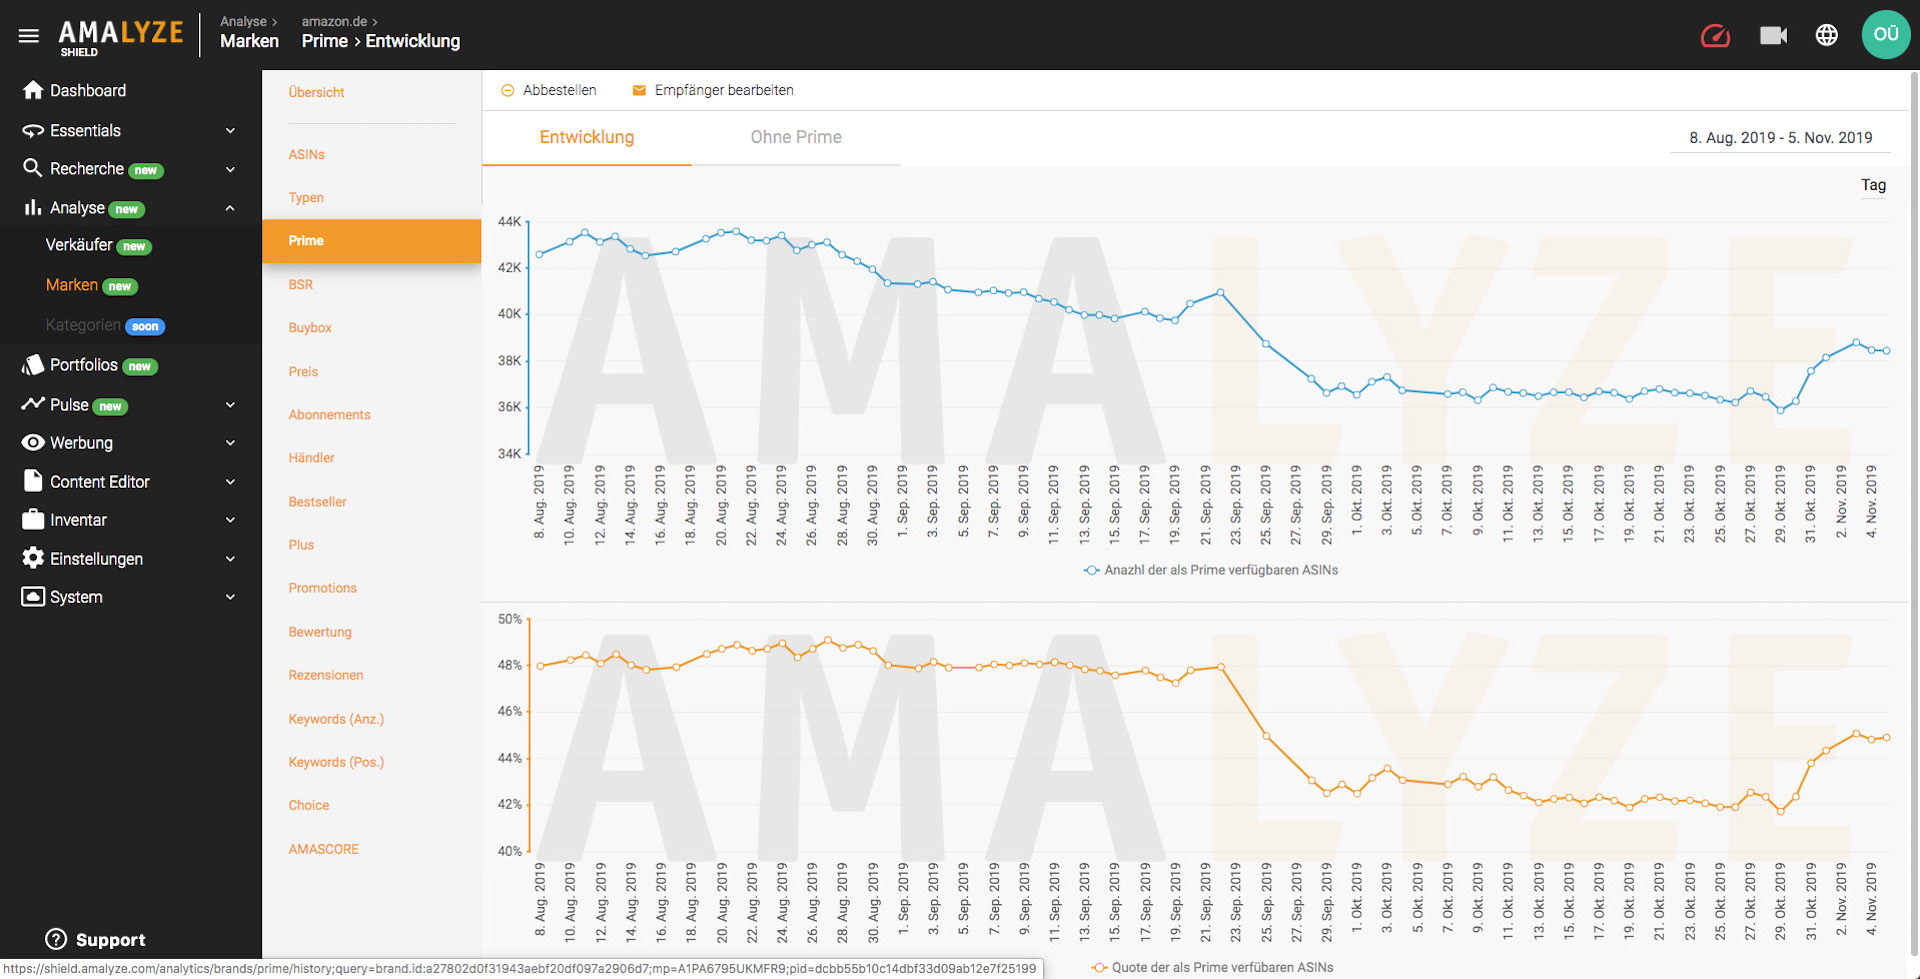
The development in relation to the number of Prime Products compared to all ASINs of the brand examined and the branded products which were not available via Prime are summarised for you in this section.
In the WITHOUT PRIME section you will also find a complete ASIN list, which has been equipped with all the filter options you already know from the product research in AMALYZE Shield. Here you can filter for buybox owners, create a price corridor, search the ASIN headlines using text filters, evaluate the organic visibility and each product is linked to its product detail page on Amazon and the ASIN analysis in Shield.
BSR Analysis
If you ever had the problem to evaluate the entire BSR development not only for a handful of ASINs, but for many hundreds or even thousands of products on Amazon, then we have excellent news for you, because from now on you can solve this task without problems.
In the Shield Brand Analysis you get together with the BSR Distribution the average BSR history of all visible ASINs of the examined brand displayed, and we automatically create a list of ASINs with the best and worst BSRs in the brand portfolio. You can also identify all top sellers and taillight products with just a few clicks.
ASIN Buybox Rate
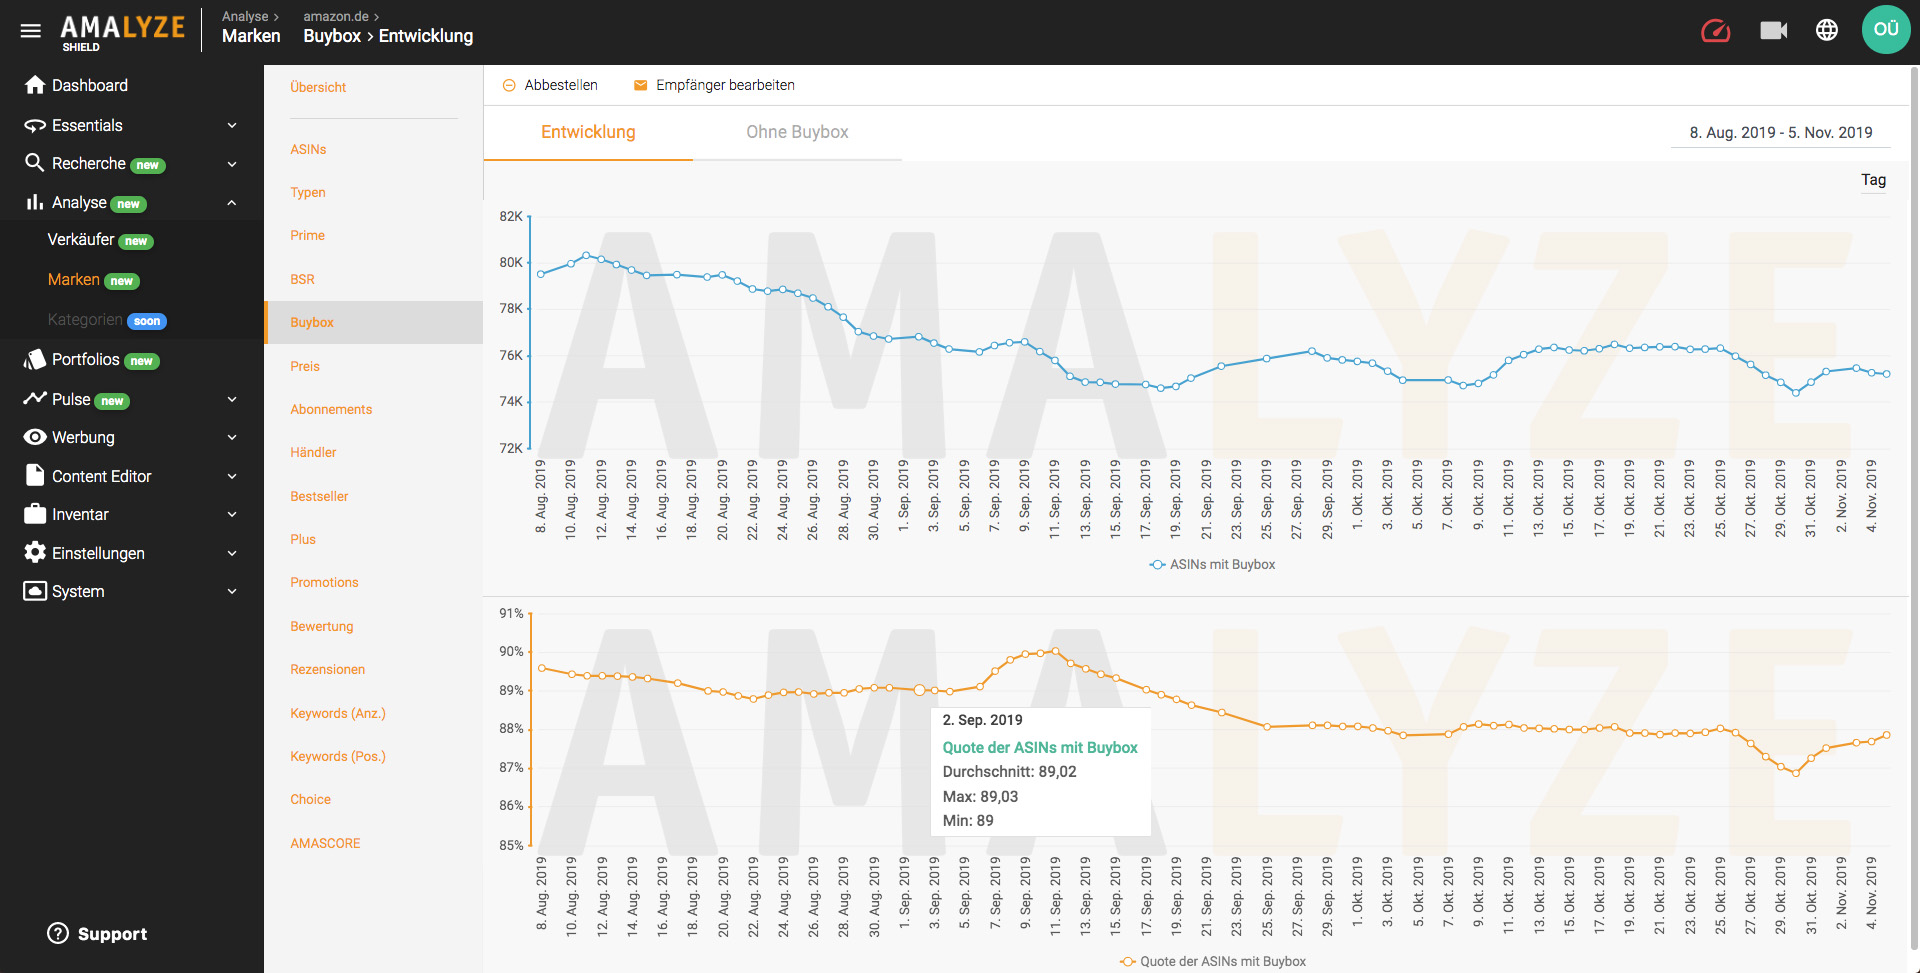
Even if a branded product may only have been sold by a single seller or listed by a vendor, this does not mean that Amazon will always award Buybox for the product, even if inventory is available.
So that you can track the number and proportion of visible ASINs of your brand that have a Buybox, we permanently monitor this value for you in the Shield Brand Analyses. All ASINs without a Buybox will be delivered to you in a result table. This gives you another early warning system to control your brand.
Price Development and Distribution
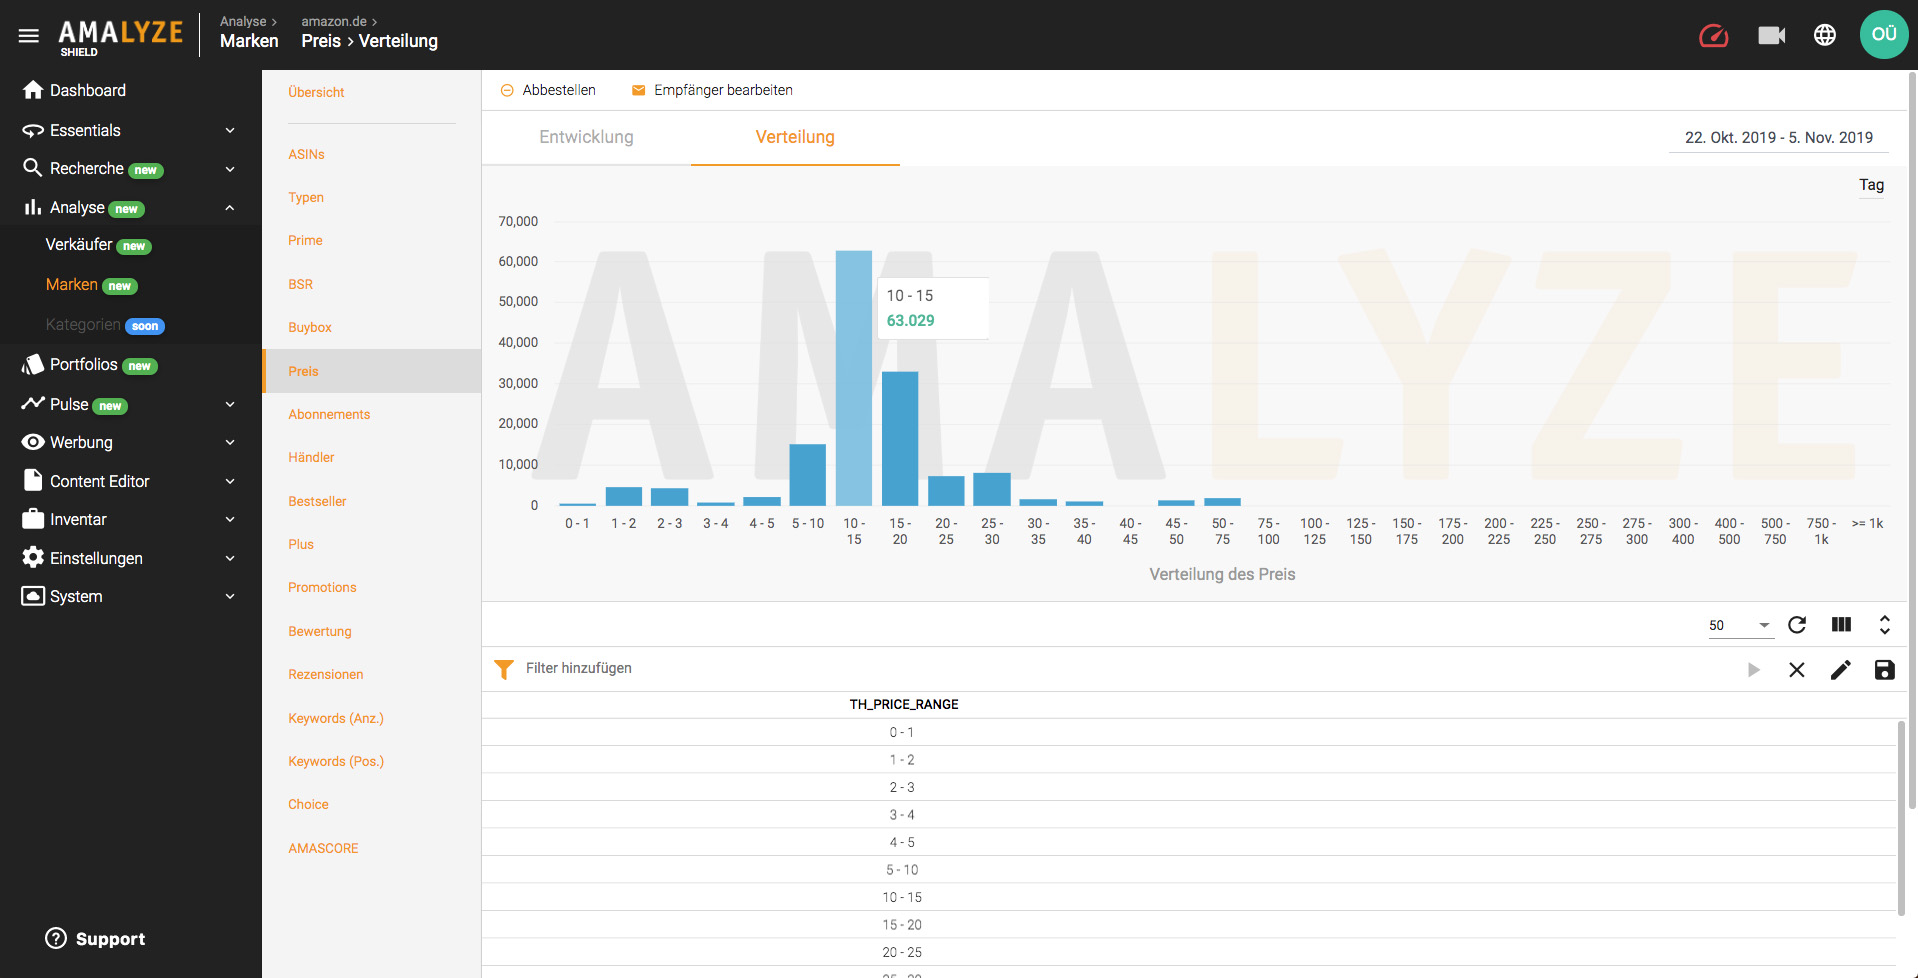
What is the average price of all ASINs of a brand offered on Amazon? And how has this value developed lately? How many products of the brand examined are offered in the different price categories? In order to provide you with a better database for strategic price optimization in the future, we summarise all these values for you in the price section of the AMALYZE brand analyses.
The distribution distribution according to sales prices also allows you to immediately see how many brand products are sold within a certain sales price corridor and how these accumulations are distributed in relation to the brand portfolio as a whole.
Visible Subscriptions
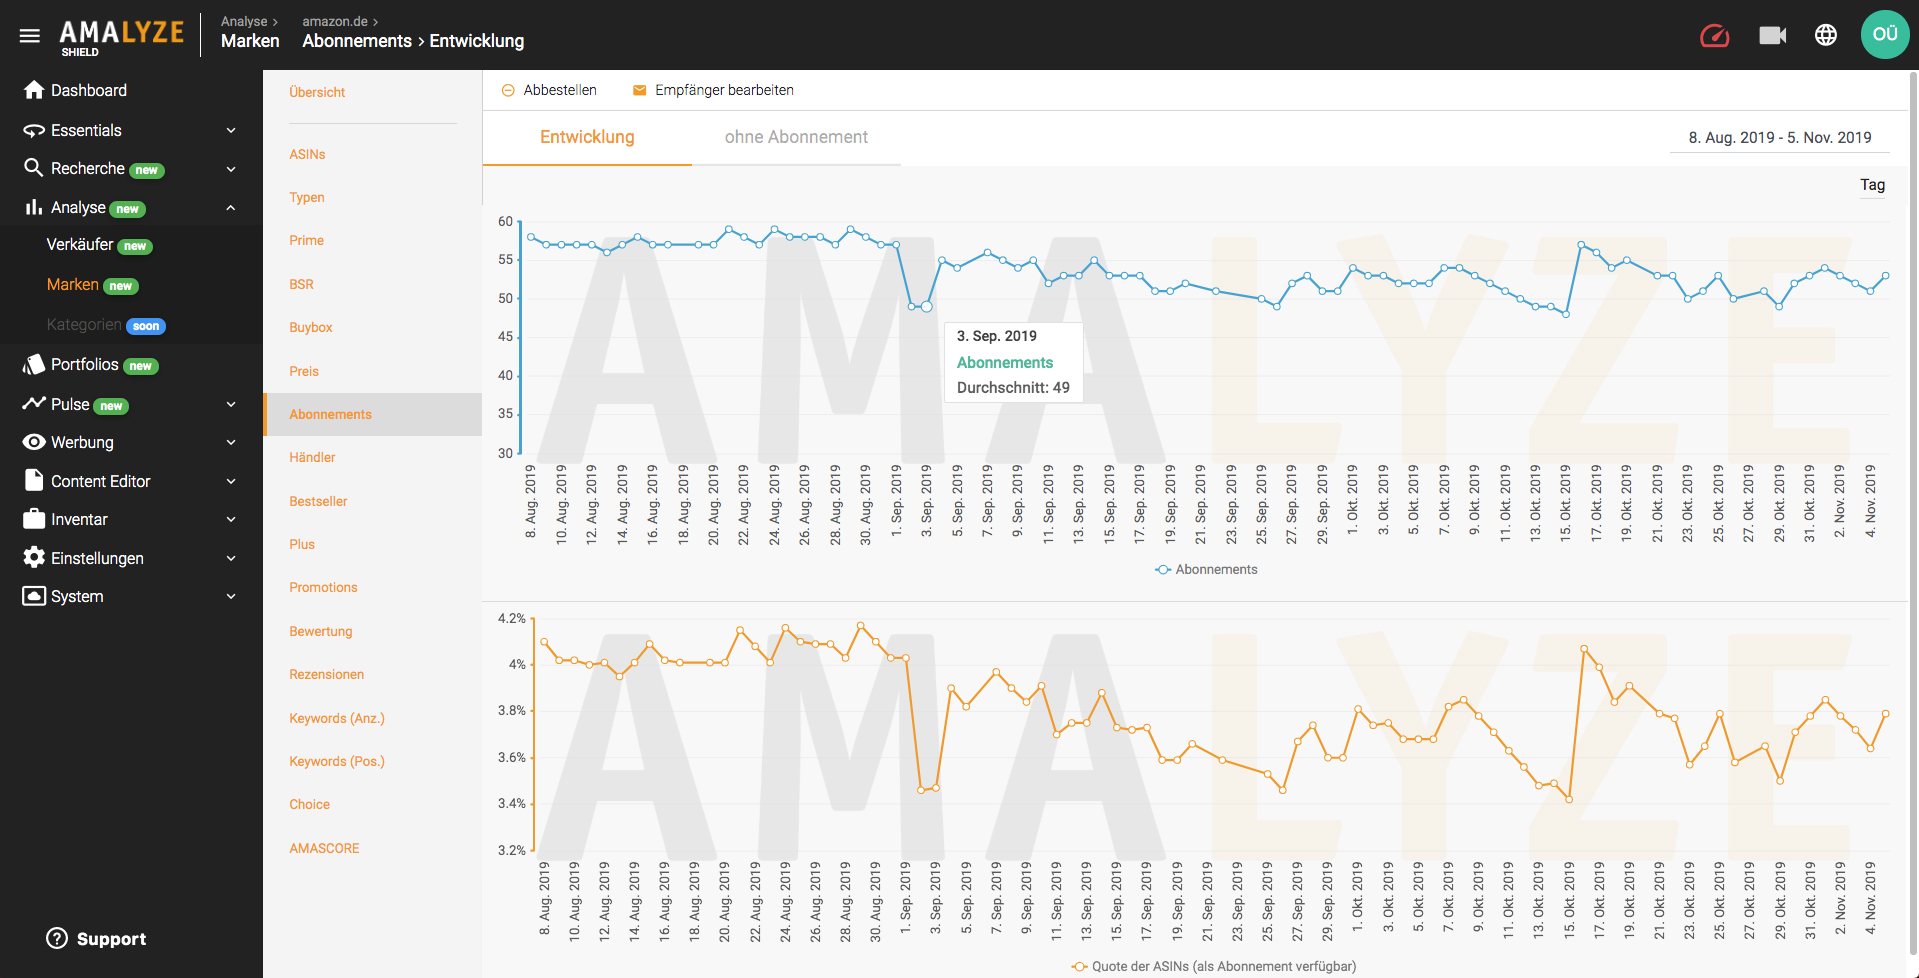
As soon as consumer products are available in a brand portfolio, they can of course also be sold to men (or women) via a savings subscription. AMALYZE Shield identifies all ASINs of the brand under investigation marked as subscription products and shows you their development.
We also calculate how high the quota of products is one can subscribe to, in relation to all ASINs of the examined brand visible to us. In an additional result table, we also show you all ASINs that were not available as subscriptions for customers on Amazon according to our latest status.
Brand Products Sold by Amazon Sellers
For a brand management as a vendor on Amazon, it can be advantageous to know how many sellers on Amazon offer your brand products on Amazon at all. And if you want to keep an eye on whether your exclusive brand suddenly appears with another seller, then this detailed view of the AMALYZE brand analysis will certainly interest you. We keep this in mind for you at all times, so that you won’t experience any more surprises in this respect.
Development of Bestsellers
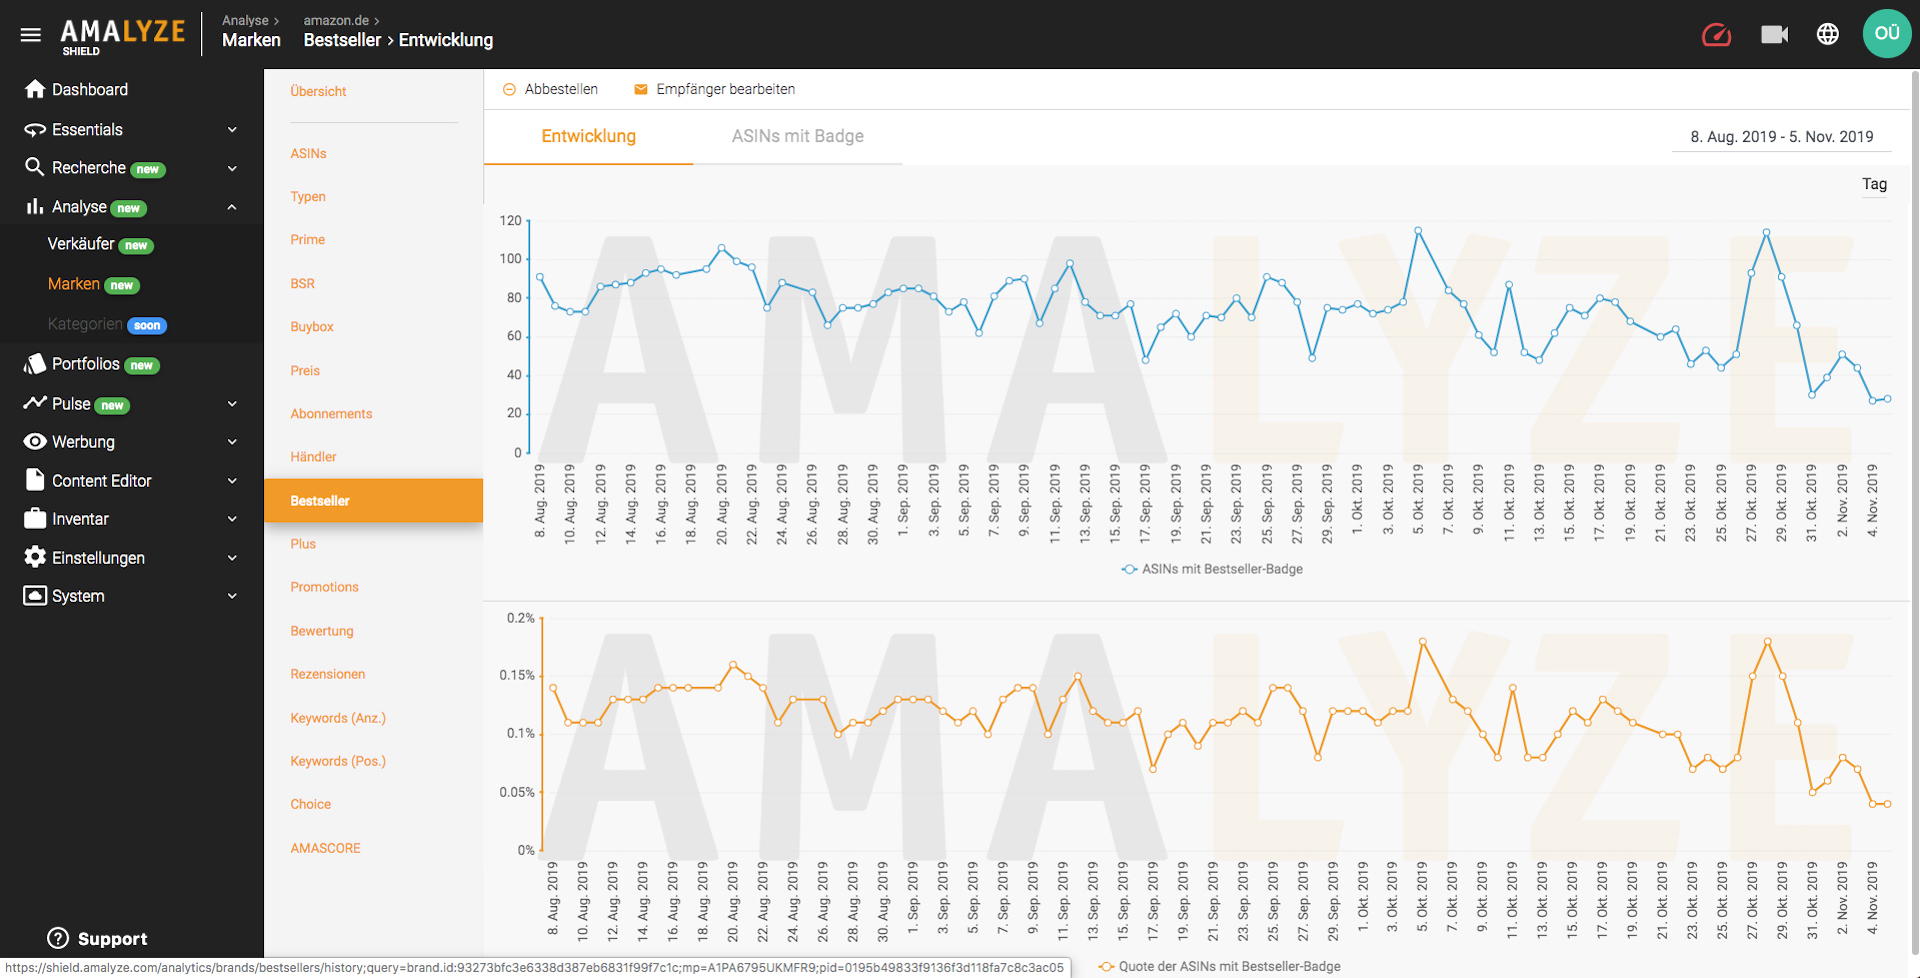
As soon as we identify bestseller products from an examined brand, you can follow the development of these ASINs with Bestseller Badge via the detailed evaluation.
In addition to a development over time based on the average number of bestseller badges, Shield also gives you the rate of bestsellers based on the total number of ASINs of this brand. In the Brand Analysis we also compile a complete results table of all brand products with bestseller status for you.
Plus Products
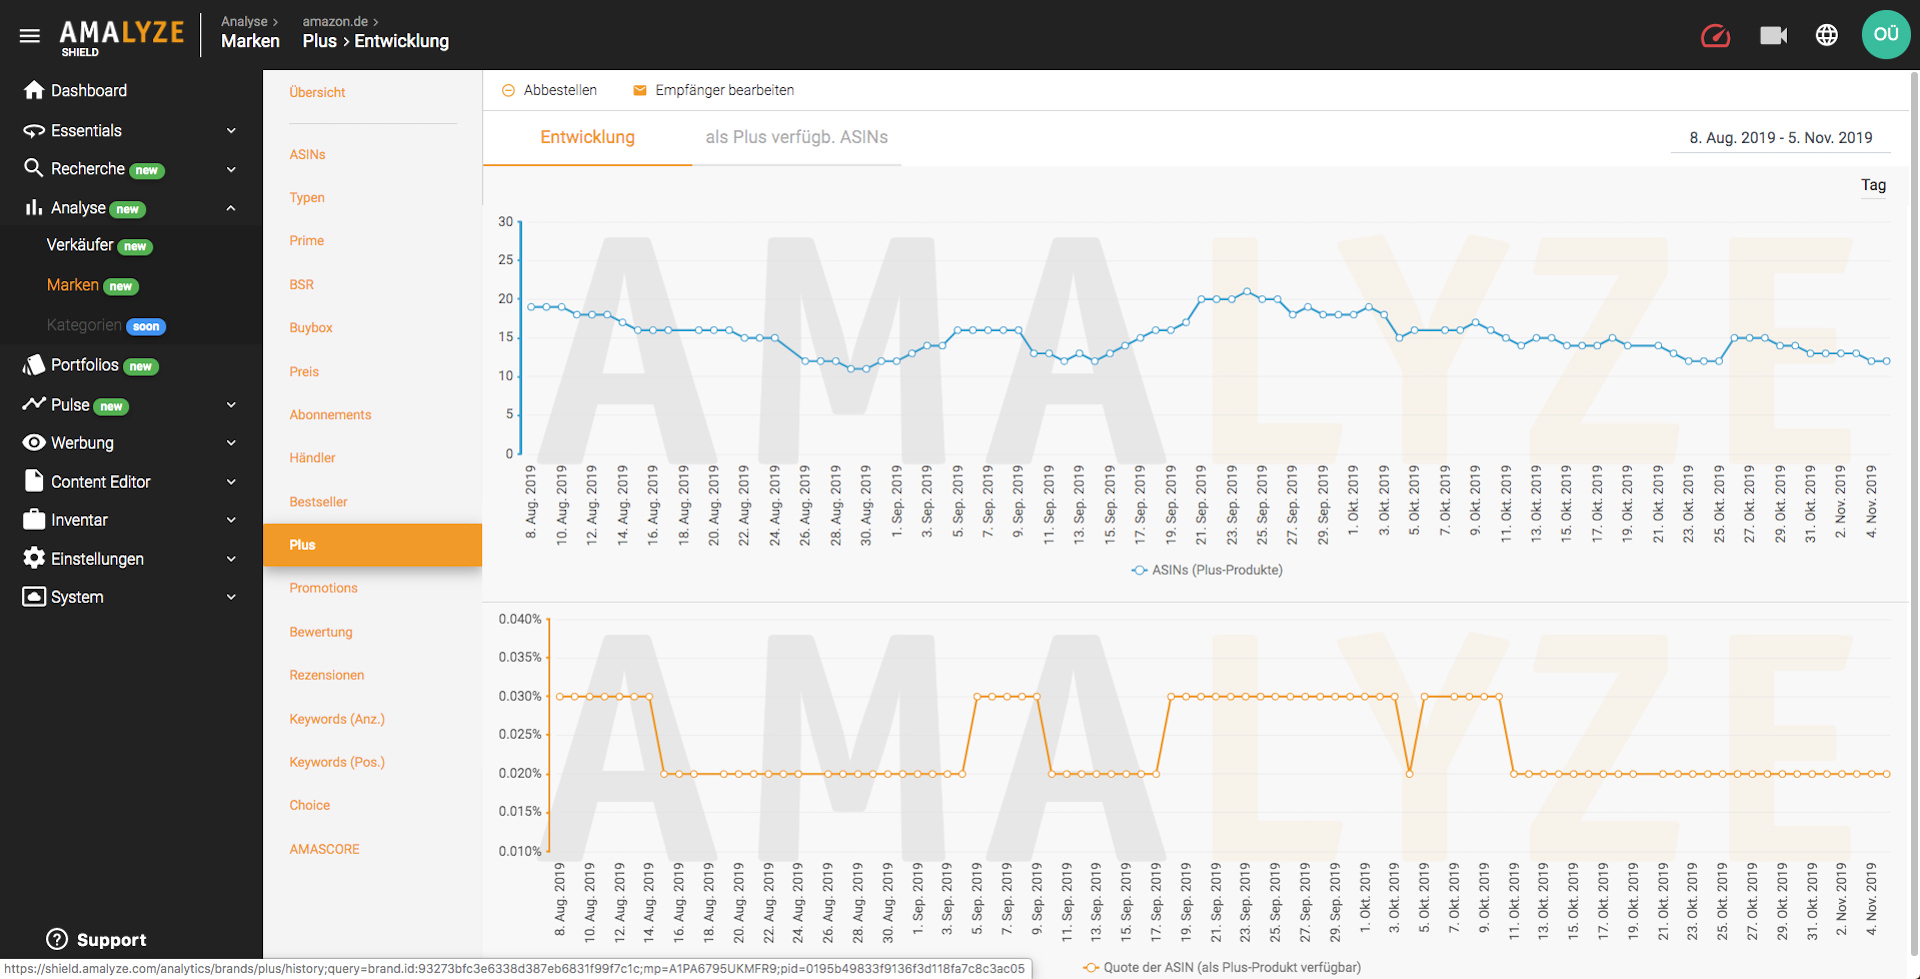
It is not always desirable when managing a brand on Amazon to have ASINs from one’s own portfolio available on Amazon as Plus products. So that you can keep an eye on the quota of Plus products and know at any time exactly which of your products on Amazon has ended up in the Plus program, if necessary without your own intervention, you will get in this detailed evaluation of the Shield Brand Analysis both their number, the Plus quota in relation to the remaining ASINs of the brand and of course a result table with all Plus products.
Visible Promotions
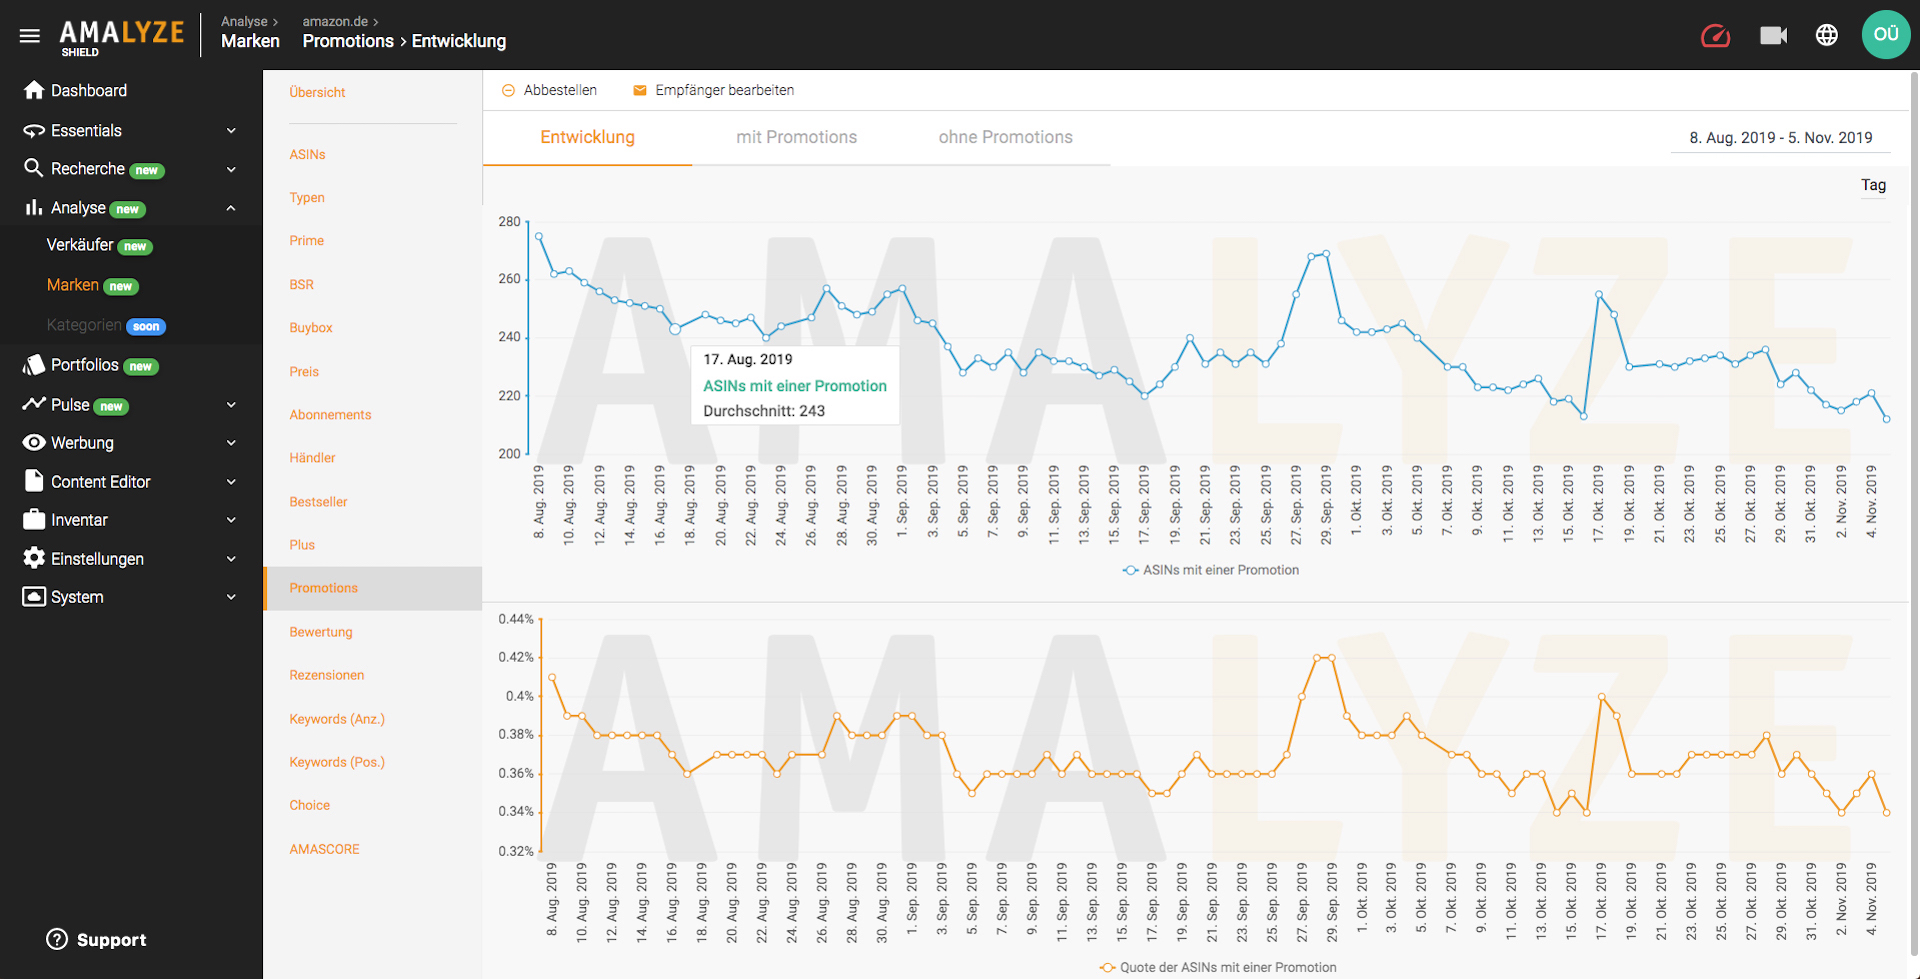
If there are ASINs among the products on Amazon where the reference to a discount campaign is visible in the SERPs, this can provide customers on Amazon with an additional incentive to click on these products first.
However, especially with a larger brand portfolio, it is possible that the overview of whether promotions are running on ASINs is lost, but these are not displayed in the search results pages at all. So that you can always keep an eye on this, we have summarized the development, the number and quota of ASINs with promotions in this detailed overview for you.
Evaluation of Ratings
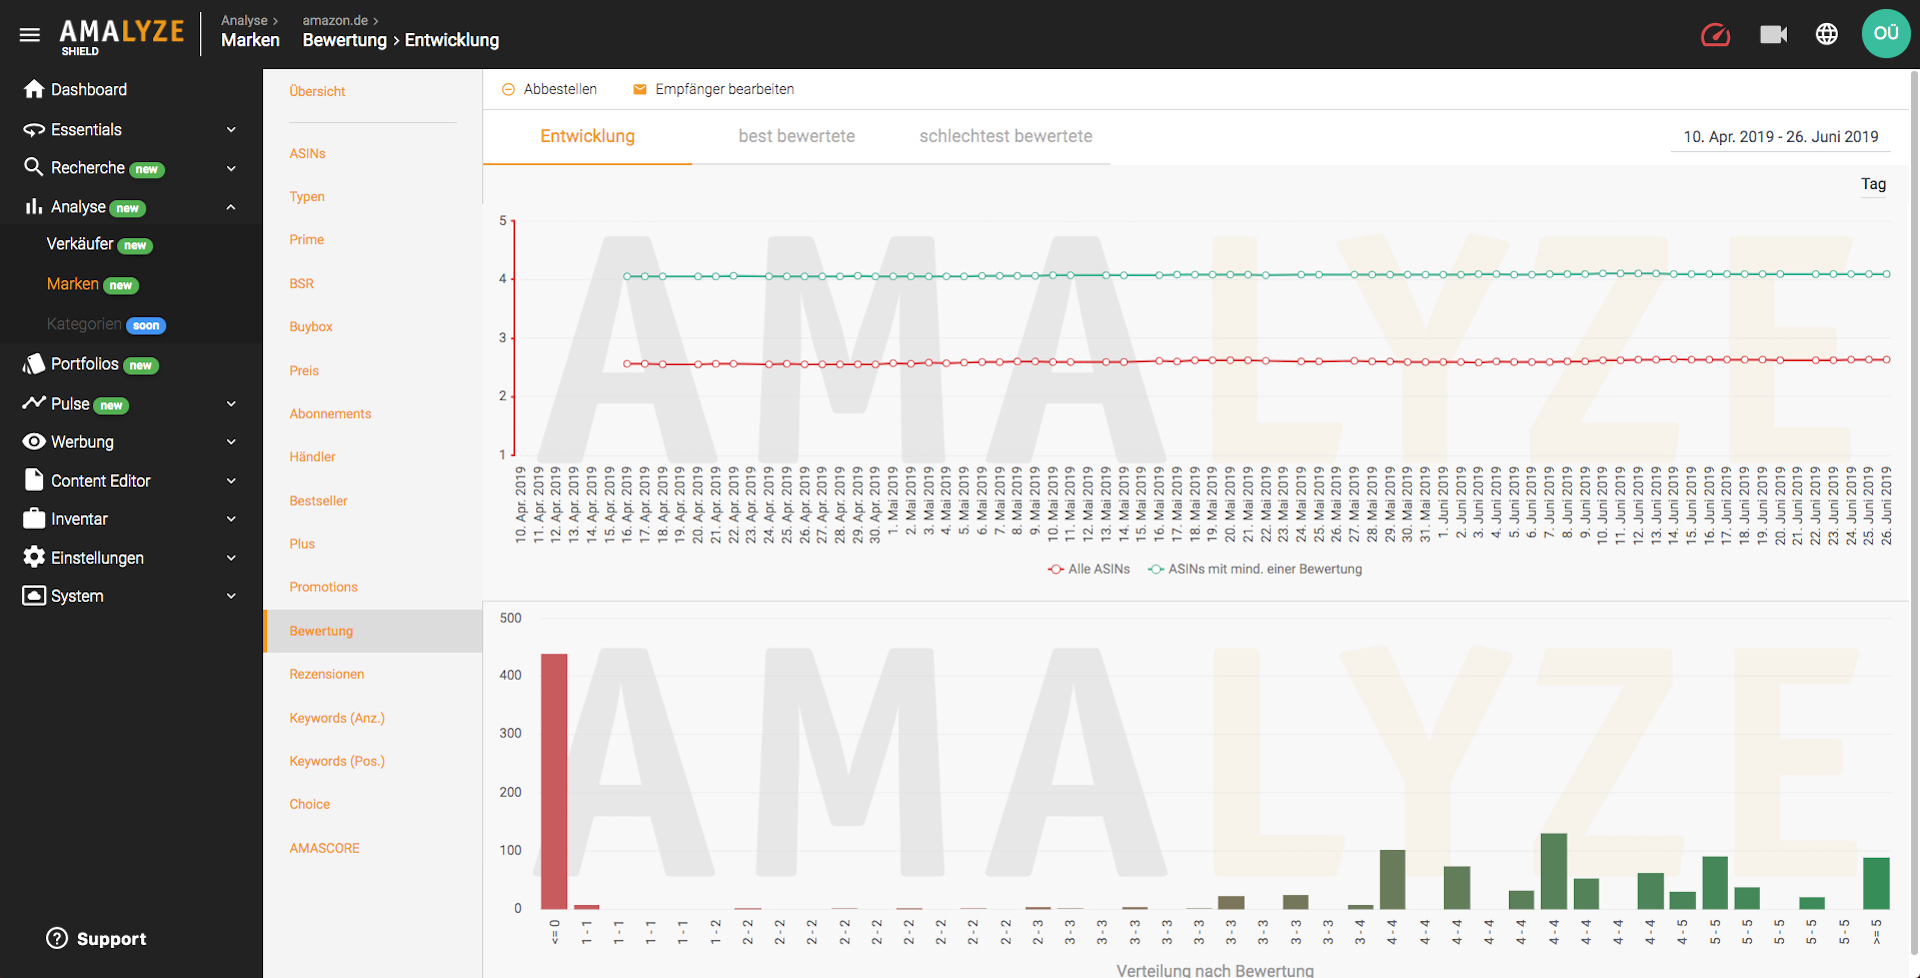
Getting feedback on your own brand products is always nice – provided the star ratings develop in the right direction. In our brand analysis you will always get an exact information about how this important strategic key figure has developed.
We therefore break down the ratings into your (or any other) brand and the overall rating. We also distinguish the ASINs in the rating statistics, which have already received at least one rating. This allows you to view the ratings picture in a much more differentiated way.
Evaluation of Reviews
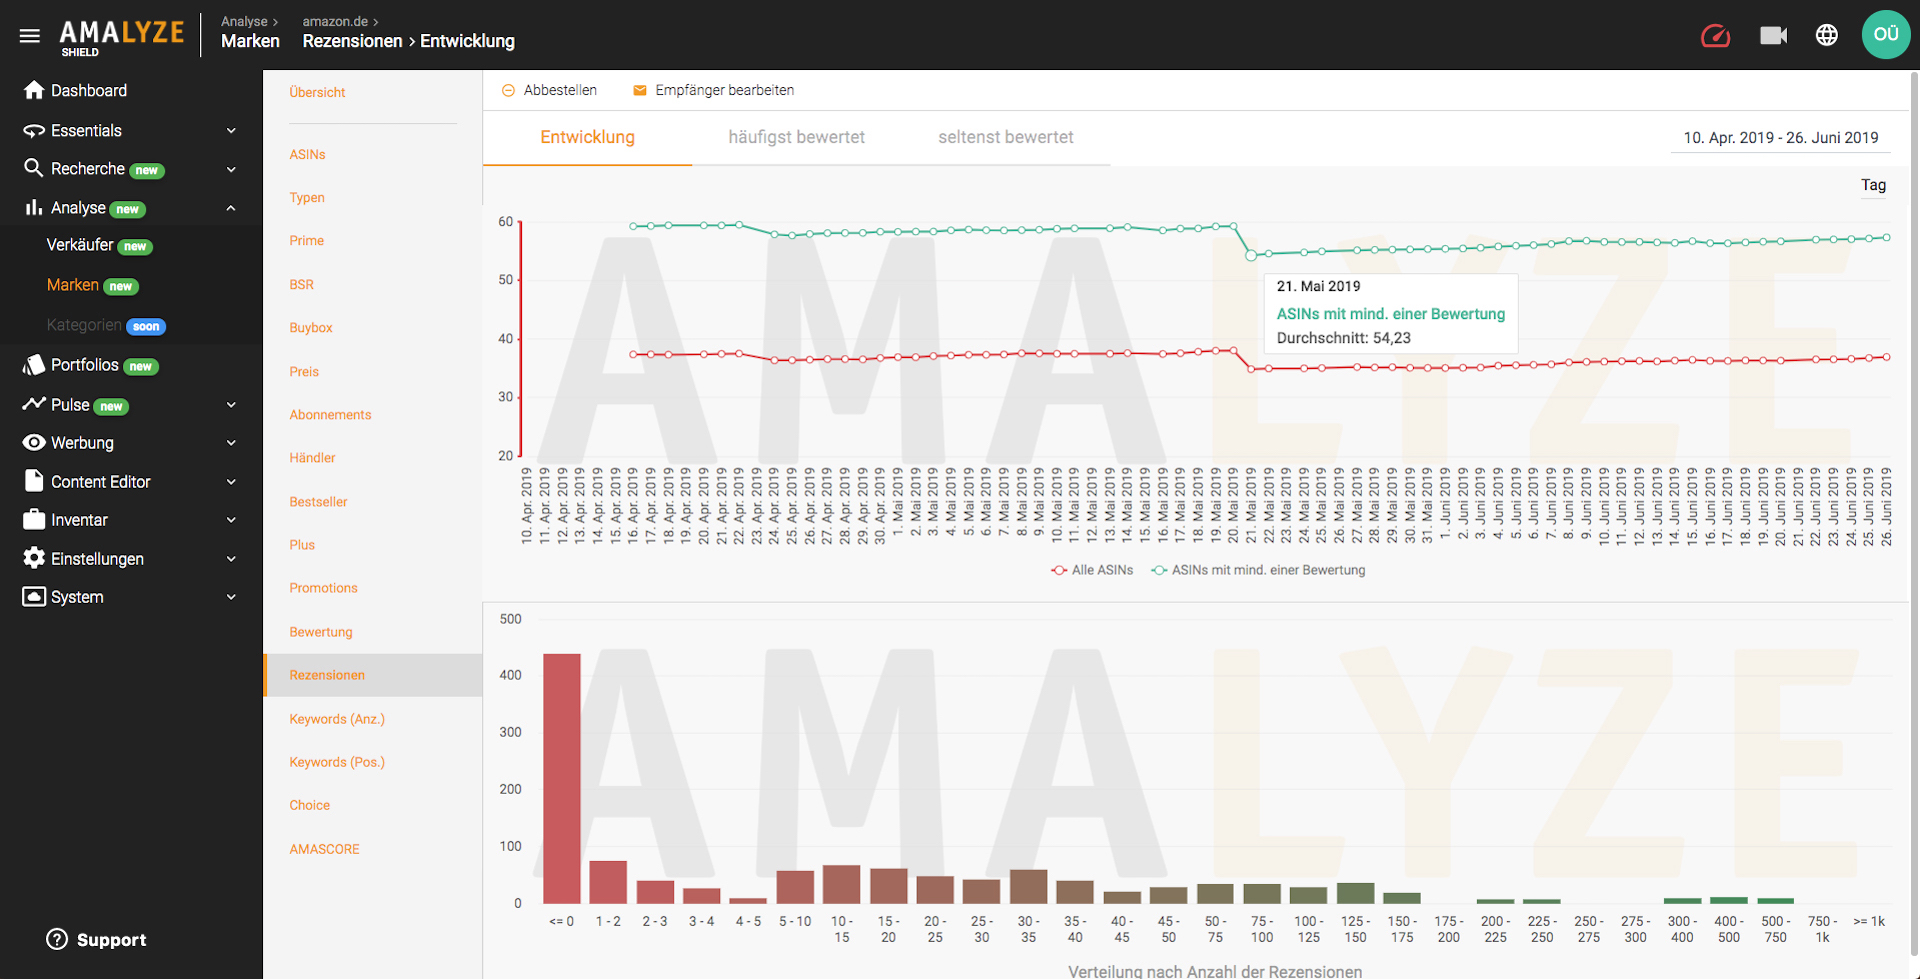
Keeping an eye on the development of all reviews is still a solvable problem for a few products. For an entire brand portfolio with several hundred or thousands of ASINs, however, this is extremely time-consuming and almost impossible to map.
The brand analysis in AMALYZE Shield now simply relieves you of this task and summarizes all review key figures in one place. Thus you receive a trend related to the total quantity and the average number of reviews per ASIN for each examined brand in Shield. In addition, we show you in a result table which ASINs were rated most frequently and which were rated least.
Keyword Quantity and ø Rankings
The amount of (relevant) keywords for which an ASIN is ranked on the Amazon marketplace will determine to a large scale, how well the product will be found by customers, therefore it can be clicked at all and thus of course how many sales can potentially be made at all.
In this detailed evaluation of the brand analysis in AMALYZE Shield you will therefore get the average number of keywords to which the products in the examined brand portfolio rank, and the distribution of the visible ASINs within the portfolio, based on the average number of keywords. In addition, we show you the products that rank among the most and least keywords.
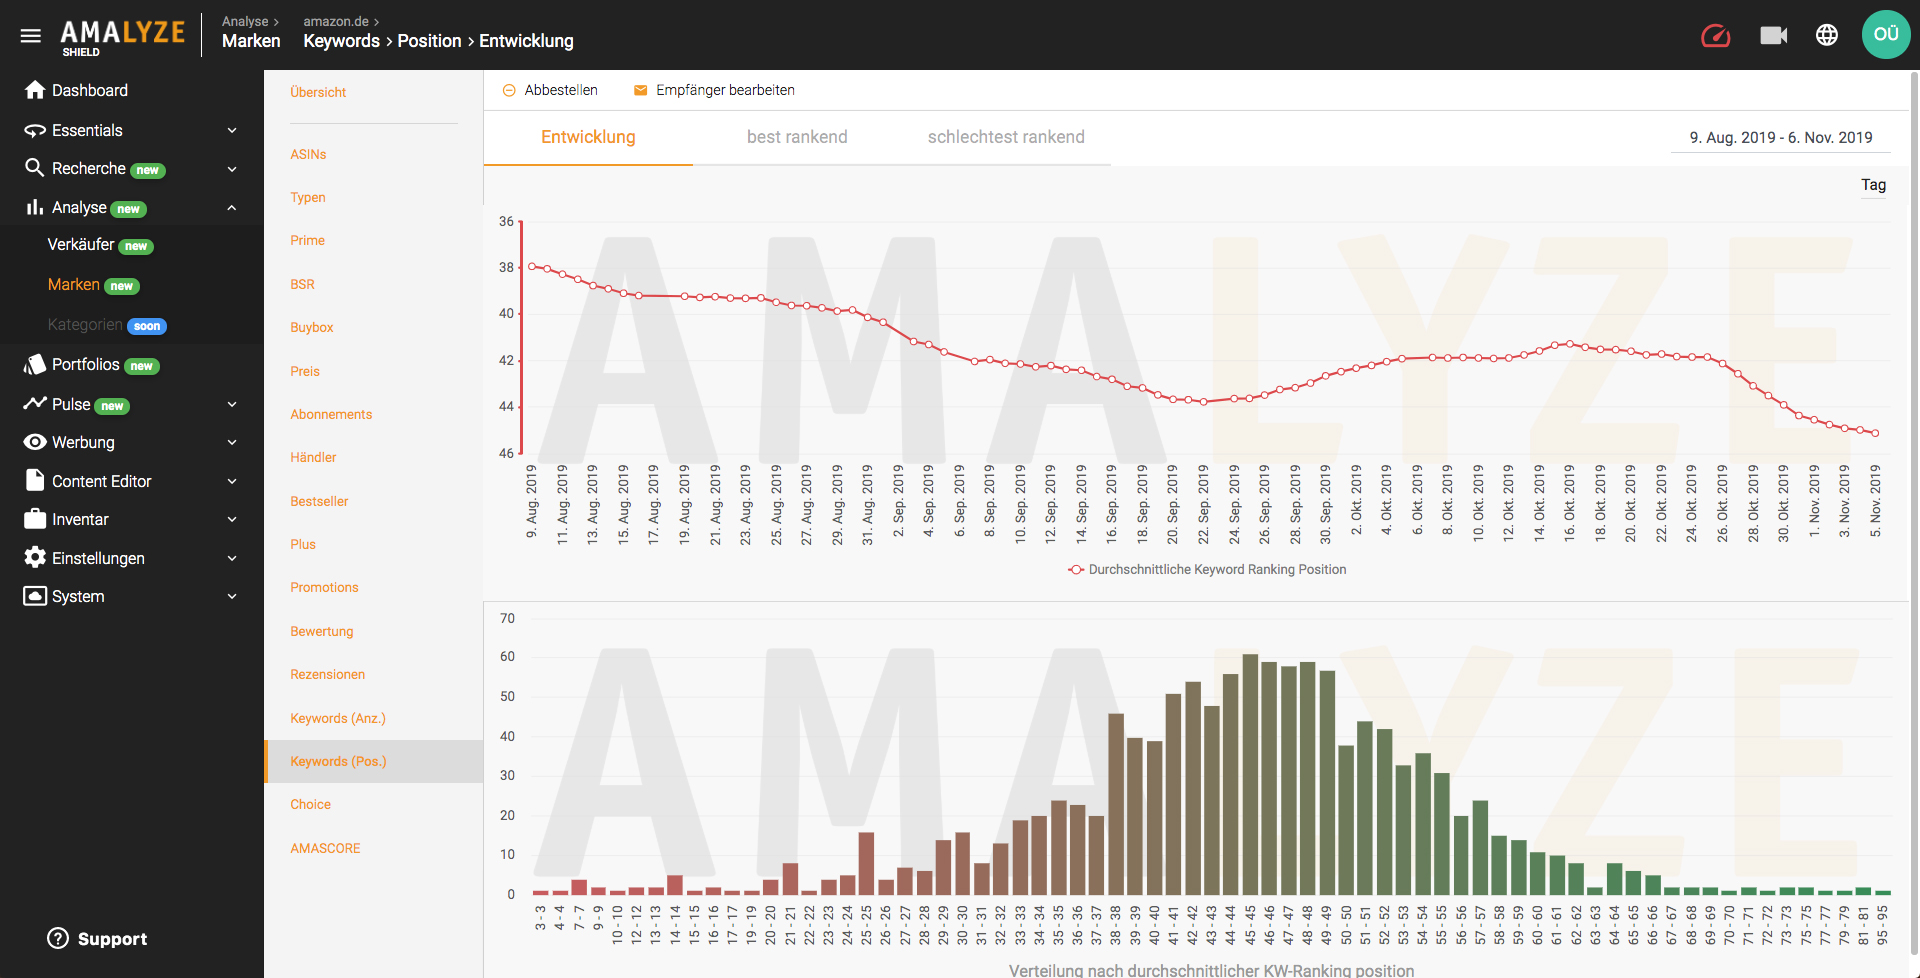
In addition to the pure amount of keywords to which an ASIN or a complete portfolio belongs, the average ranking position on which products appear on the Amazon marketplace in the SERPs essentially determines whether they can be found well (or at all) by customers on Amazon or not.
So that you can always keep a perfect eye on this development, we have first built two charts for you: In addition to the average ranking position displayed in relation to all visible ASINs of the brand, you also get a distribution display in relation to their distribution. Of course, it would be desirable to have as many ASINs as possible, which have a good average ranking position despite a large number of ranking keywords. Additionally, you can see the best and worst ranked ASINs in a separate result table.
Overview & Development of Choice Badges
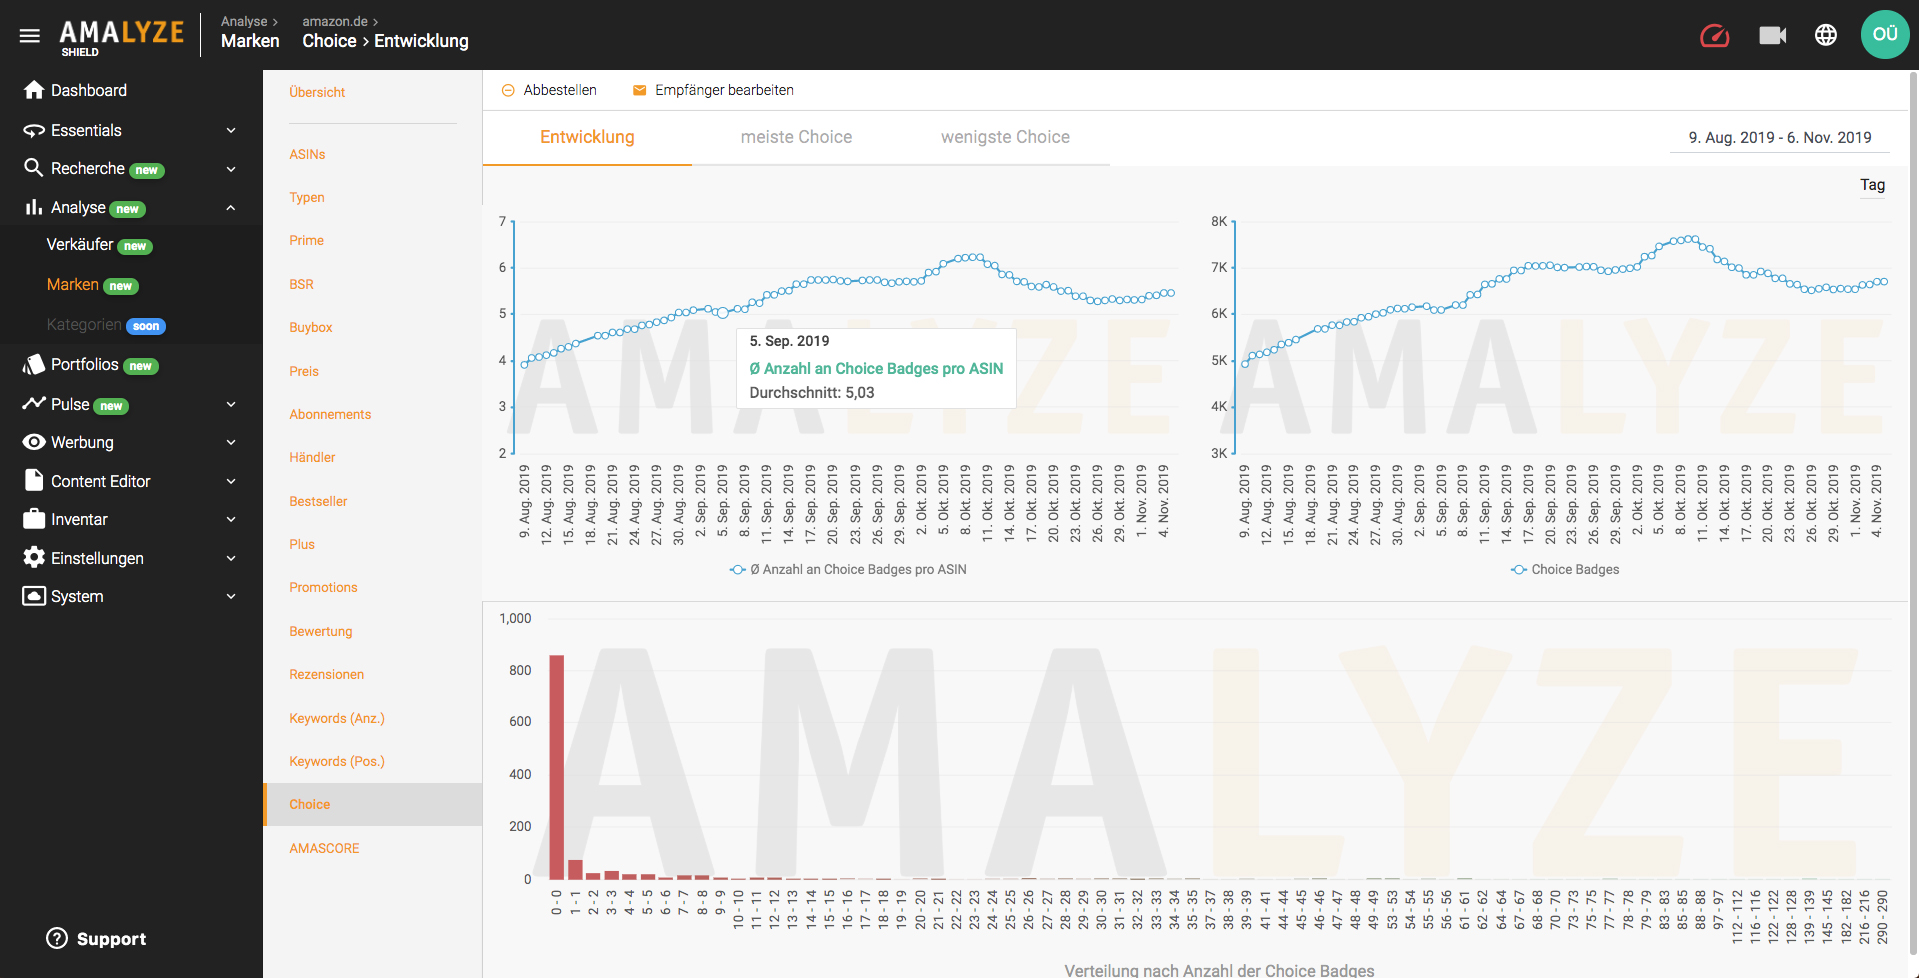
In addition to the Amazon Bestseller Badge, the Amazon Choice Badge also signals, products with a certain “special status” to potential customers on Amazon, as the Choice Badges are already visible in the SERPs during a product search. A positive development in relation to the number of choice badges in the brand portfolio examined can have a beneficial effect.
Since the Amazon Choice Badges are always assigned on a keyword basis, only one ASIN can ever consider the Choice Badge to be a specific keyword. So that you always have an eye on how the number of Choice Badges develops in relation to an examined brand portfolio, in this detailed view of the Shield Brand Analysis we summarize the average number, the development trend in relation to the total quantity and the distribution across all ASINs visible to us. This is supplemented by two result tables for the ASINs with the most and the fewest Choice Badges.
AMASCORE: Overall Organic Visibility
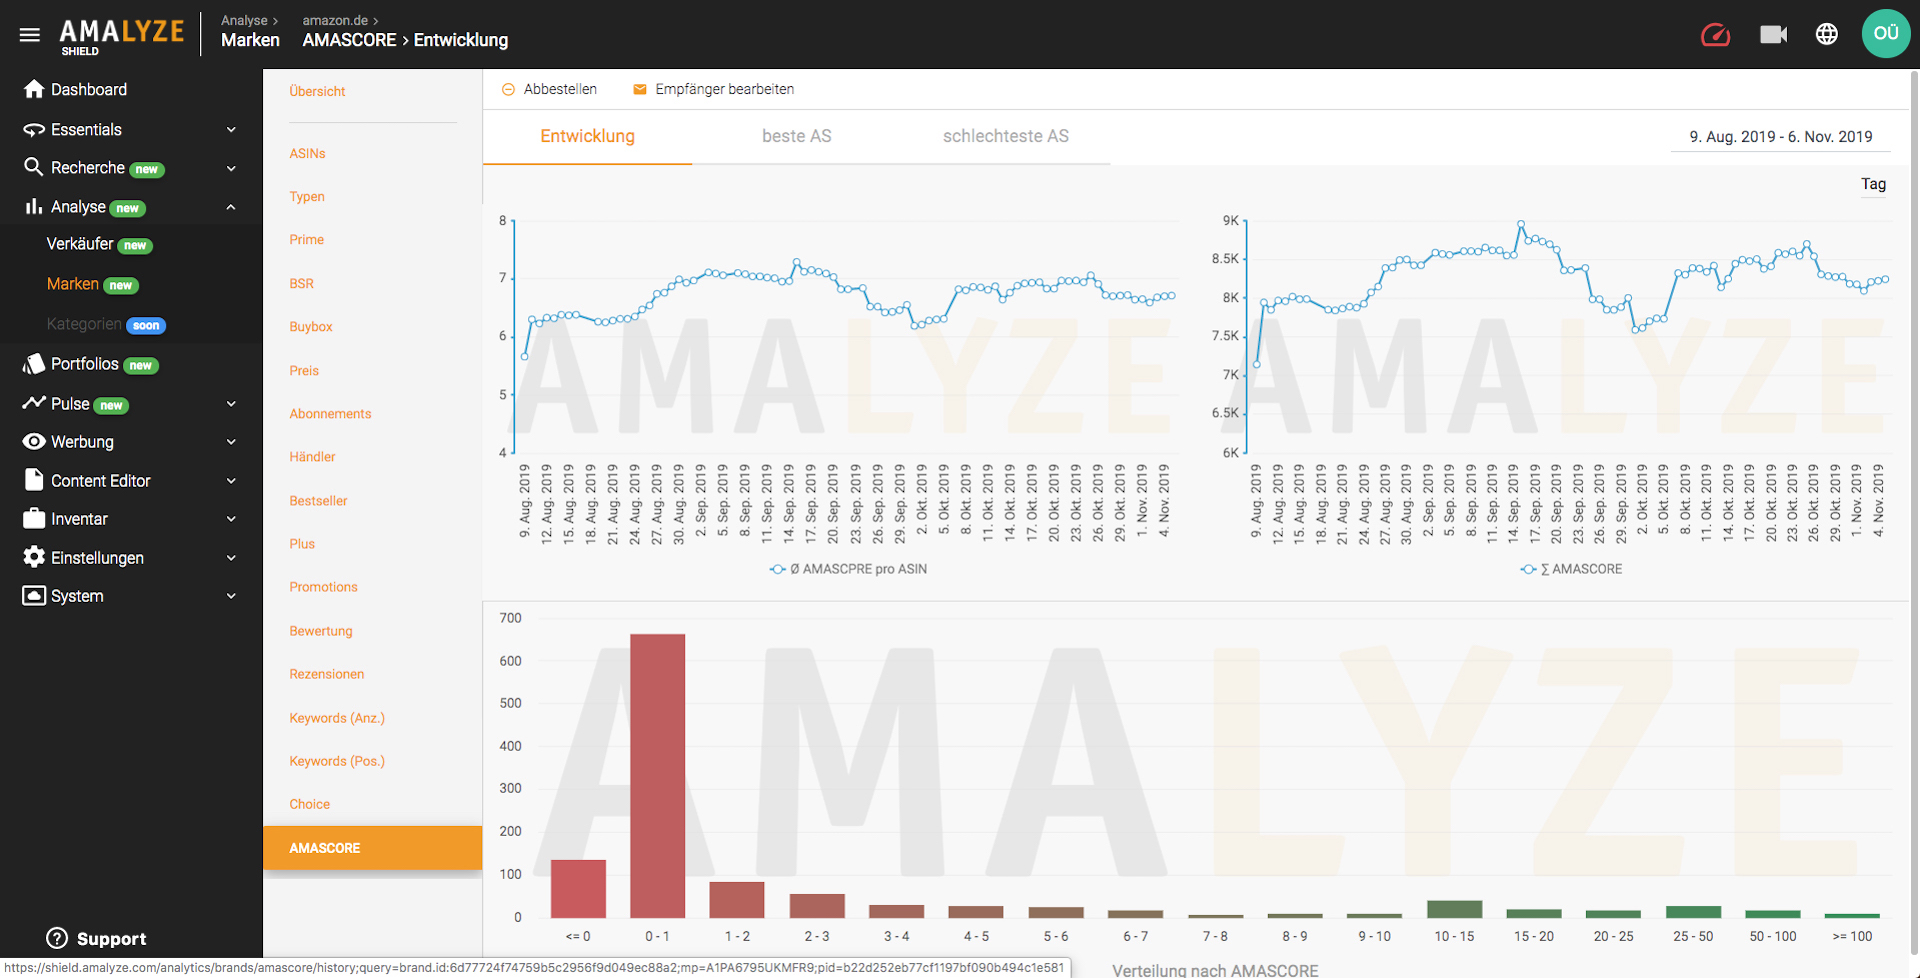
We calculate the organic visibility of a product on Amazon, the AMASCORE (AS), from the number of (relevant) keywords to which an ASIN ranks, and the resulting average ranking position (as well as various other values). The higher the cumulative AMASCORE relative to the total number of ASINs in the corresponding brand portfolio, the more visible these brand products are organically for customers on Amazon willing to buy.
Thus, for the first time, a direct, objective comparison is possible based on the visibility of several brand (or seller) portfolios on an Amazon marketplace. You can always keep an eye on the trend development of your own values via the average AMASCORE per ASIN, the cumulated AMASCORE and the distribution table. In addition, as usual, we will give you a result table with the ASINs for the best and worst AS-values.
Need more information about AMALYZE Shield?
Would you like to create your own individual portfolios and monitor them permanently? No problem at all. Follow the link and we will show you exactly what possibilities you have and how this exactly works. Curious? We thought so.
AMALYZE Shield Live Demonstration
You want to see the whole AMALYZE tool for Amazon in action from the inside without further obligations, let yourself be guided through all basic functions and ask questions? No problem: Just take part in a free live webinar. Follow the link to the dates now.


